Chart of Accounts Template
Free
Numbers do not lie — but they can absolutely mislead if they are categorized poorly. A business without structure in its financial architecture is like a factory floor without labeled bins. Parts are moving. Money is moving. But clarity? Gone. That’s exactly why a Chart of Accounts is not optional. It is foundational.
A properly designed Chart of Accounts provides the backbone of the entire accounting ledger structure. Every transaction — whether it is raw material spend, freight, payroll, or capital equipment — flows through the general ledger accounts list. If those accounts are vague, duplicated, or poorly numbered, financial reporting becomes distorted. Margin looks inflated. Overhead appears mysterious. Working capital becomes guesswork instead of measurable reality.
At its core, a Chart of Accounts is a structured financial reporting framework that categorizes transactions into asset liability equity accounts and revenue and expense accounts. These classifications are not academic exercises. They determine how leadership understands profitability, liquidity, leverage, and operational performance.
Think of it this way: you cannot manage what you cannot see. And you cannot see what you do not classify correctly.
Chart of Accounts – Financial Clarity Begins with Structure
The business chart of accounts structure defines how transactions are grouped and reported. When built properly, it supports:
- Standardized account coding
- Cost center mapping
- Departmental expense tracking
- Inventory asset classification
- Capital expenditure categorization
Without this structure, expenses often get buried under generic categories like “miscellaneous” or “other costs.” That is not accounting — that is avoidance.
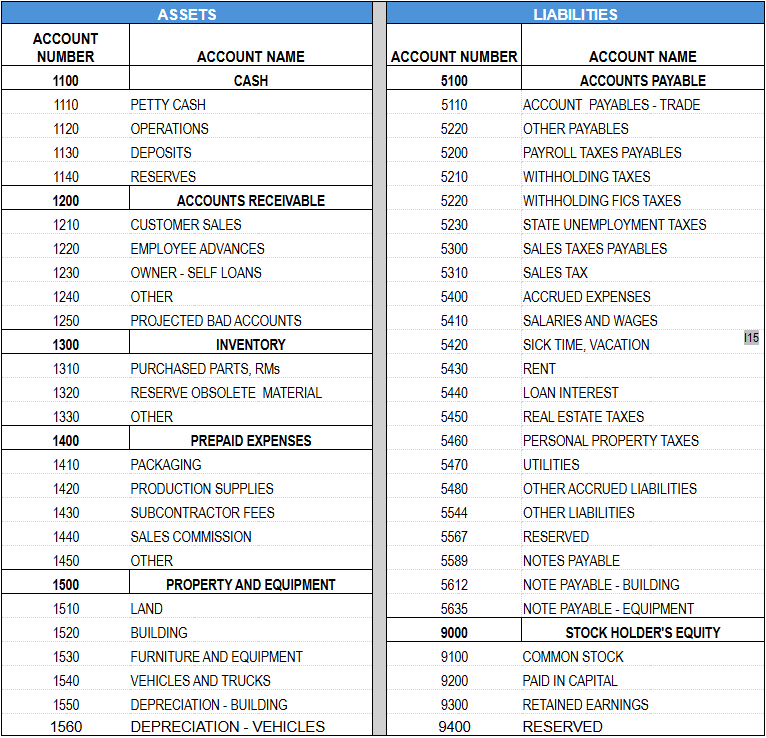
A disciplined accounting numbering system ensures logical grouping. For example, 1000-series accounts for assets, 2000-series for liabilities, and so on. This hierarchy strengthens consolidated financial reporting and supports ERP chart configuration across multiple entities. If your organization operates in several divisions or legal structures, a multi-entity accounting structure becomes critical for maintaining clean reporting.
With a Chart of Accounts Business is Governance, Compliance, and Control
A Chart of Accounts for Business is also a governance mechanism. It reinforces internal controls in financial reporting and supports segregation of duties in accounting. When GL coding controls are clearly defined, it becomes harder for expenses to be misclassified intentionally or accidentally.
This strengthens:
- Audit trail integrity
- Fraud prevention controls
- SOX compliance structure
- Financial transparency standards
- Board-level reporting clarity
A sloppy expense classification system creates vulnerability. Misclassified costs distort EBITDA reporting accuracy. Overhead allocation errors skew margin analysis by category. Working capital visibility becomes compromised. Executives begin making strategic decisions based on flawed data.
Precision in the corporate accounting structure reduces that risk.
A Chart of Accounts Means Operational Intelligence and Decision-Making
A Chart of Accounts is not just about compliance. It is about operational cost intelligence.
When revenue and expense accounts are aligned with spend category alignment and procurement-to-pay account mapping, leadership gains visibility into where money is flowing. Budget-to-actual variance tracking becomes meaningful. Performance measurement alignment improves.
For manufacturing companies, this can mean the difference between:
- Accurately tracking cost of goods sold versus burying freight in overhead
- Separating direct material from indirect spending
- Monitoring inventory asset classification properly
- Distinguishing capital expenditures from operating expenses
These distinctions influence margin reporting, tax positioning, and long-term investment strategy.
The accounting ledger structure should mirror how the business operates. If production is segmented by product line, the accounts should allow margin visibility by product line. If procurement is strategic, spend category alignment should reflect major sourcing categories. That is enterprise financial architecture — not bookkeeping.
Scalability and Growth is Supported by a Chart of Accounts
Growth exposes weak structure. A startup may survive with a simplistic general ledger accounts list. A scaling organization cannot.
As complexity increases, the need for:
- Scalable accounting infrastructure
- ERP chart configuration
- Cross-functional financial governance
- Compliance-ready accounting framework
becomes unavoidable.
A Chart of Accounts must evolve alongside the organization. New revenue streams require new revenue and expense accounts. Acquisitions demand careful integration into the existing financial reporting framework. Without discipline, the chart becomes bloated, redundant, and unusable.
The key is balance: detailed enough to provide cost visibility controls but structured enough to remain clean and navigable.
Preventing Strategic Blind Spots with a Chart of Accounts
Many executives focus on revenue growth while ignoring structural financial clarity. That is like upgrading machinery while ignoring calibration.
If expenses are miscategorized:
- Margin analysis becomes unreliable
- Capital allocation decisions become distorted
- Working capital optimization suffers
An accurate business chart of accounts structure supports data-driven financial decision-making. It enables EBITDA reporting accuracy. It strengthens overhead allocation methodology. It improves consolidated financial reporting across divisions.
In short, it protects strategic judgment.
The Bottom Line: A Chart of Accounts Is more than Numbers
A Chart of Accounts is more than a list of numbers. It is the financial nervous system of the organization. It defines how information flows, how costs are classified, and how performance is measured.
When structured correctly, it supports:
- Clear asset liability equity accounts
- Logical revenue and expense accounts
- A disciplined expense classification system
- Strong internal controls in financial reporting
- Reliable audit trail integrity
- Enterprise-wide financial transparency
When structured poorly, it quietly undermines decision-making.
Businesses do not collapse overnight. They drift — often because financial signals are blurred. A properly designed Chart of Accounts eliminates that blur. It transforms raw transactions into operational intelligence and strategic clarity.
And in a world where capital is tight, margins are scrutinized, and governance expectations are rising, clarity is not a luxury. It is a competitive advantage.
You can find a simple example of a Chart of Accounts by following the link below.
https://getyourpurchasingdocuments.com/product/chart-of-accounts/
If you’d like to learn more about a Chart of Accounts for Business, please check out one of the links below.
https://www.investopedia.com/terms/c/chart-accounts.asp
https://learn.microsoft.com/en-us/dynamics365/business-central/finance-chart-of-accounts
Products Include:
The price includes links to everything you need to use the form(s). The forms, explanation, examples, and the link download(s) are located in your account under Digital Forms.
Chart of Accounts Template
Purchase now and get immediate access the file
Free
